 Get premium membership
 and access revision papers with marking schemes, video lessons and live classes.
The curves below represents the changes in the concentration of substance E and F with time in the reaction;
E(e) #overset(rightarrow)(leftarrow)# F(g)
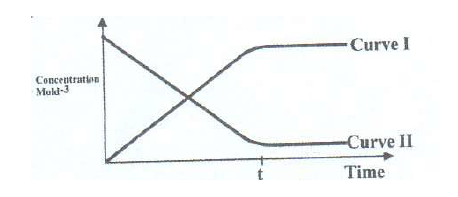
(a) Which curve represents the change in concentration of substance F? Give a reason.
(b) Give a reason for shapes of curves after time ‘t’ minutes.