 Get premium membership
 and access revision papers with marking schemes, video lessons and live classes.
The table below shows the number of 90kg bags of maize that Mutiso sold to a miller in the years 1998 to 2002.
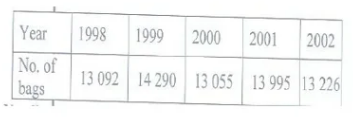
In which years did Mutiso have the least increase in the number of bags sold?
A. Years 2001 and 2002
B. Years 2000 and 2001
C. Years 1999 and 2000
D. Years 1998 and 1999