 Get premium membership
 and access revision papers with marking schemes, video lessons and live classes.
The table below shows Mwasi’s income from the sale of farm produce, during one year.The information on the income for potatoes is not given.
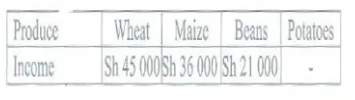
A pie chart was drawn to represent the information above. If the angle representing the income for beans was #63^(0)#. What was the income for potatoes?
A. Sh 120000
B. Sh 18000
C. Sh 17850
D. Sh 102000