 Get premium membership
 and access revision papers with marking schemes, video lessons and live classes.
The graph below represents the increase in the number of yeast cells over a period of 48 minutes.
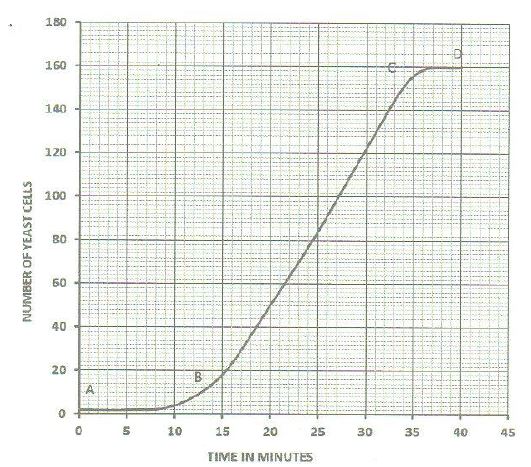
(a) Name the type of curve show
(b) Determine the number of yeast cells after 26 minutes
(c) Work out the rate of cell division between 24 and 28 minutes
(d) After how long was the population of yeast cells 128?
(e) Name the phase of the curve labelled
(i) A to B
(ii) B to C
(f) Give reasons for the shape of the graph between points C and D
(g) State five factors, which would cause human population growth to assume the shape of the graph curve between points B and C