 Get premium membership
 and access revision papers with marking schemes, video lessons and live classes.
The graph in figure 8 shows the variation of photoelectric current with applied voltage when a surface was illuminated with light of a certain frequency. Use the information in the figure to answer questions that follow.
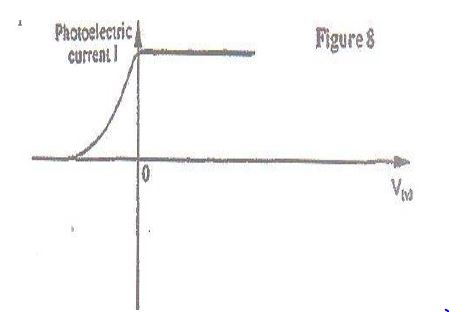
a) On the same axis, sketch the graph when light of higher intensity but same frequency is used to illuminate the surface.
b) Explain your answer in question (a) above.