 Get premium membership
 and access revision papers with marking schemes, video lessons and live classes.
The curve below represents the variation of temperature with time when pure and impure samples of a solid were heated separately
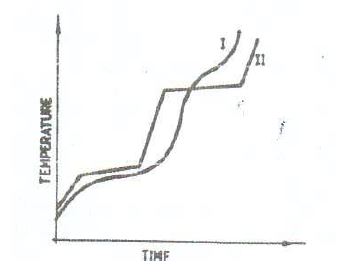
Which curve shows the variation in temperature for the pure solid? Explain.