Get premium membership
 and access revision papers with marking schemes, video lessons and live classes.
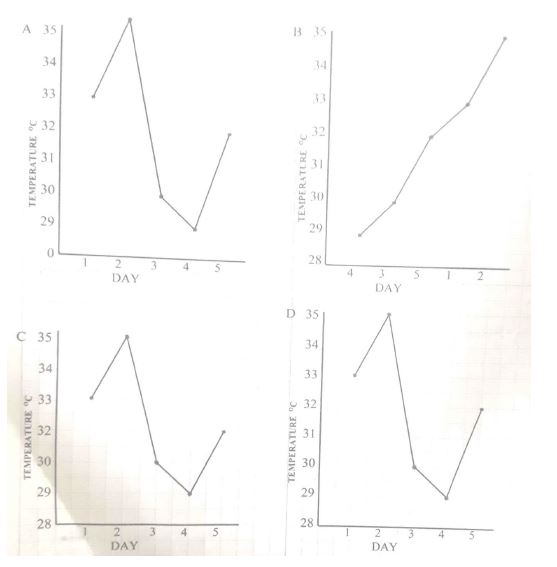
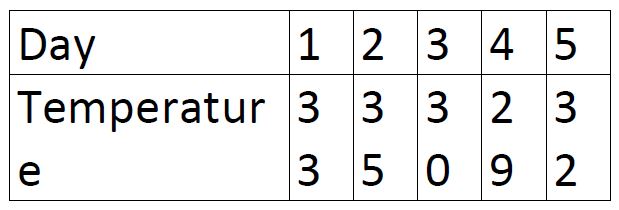
Standard VII pupils at Kale Primary School measured the room temperature each day for 5 days. They recorded their measurements in a table as shown below.
Which one of the following graphs is drawn CORRECTLY
to represent the information in the table?