Get premium membership
 and access revision papers with marking schemes, video lessons and live classes.
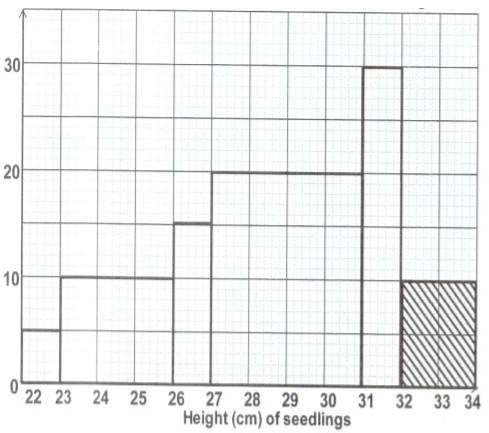
The histogram shown below represents the distribution of heights of seedlings of a certain plant. The shaded area in the histogram represents 20 seedlings. Calculate the percentage number of seedlings with heights of at least 23 cm but less than 27 cm.