 Get premium membership
 and access revision papers with marking schemes, video lessons and live classes.
The frequency distribution table below shows the weekly salary (K£) paid to workers in a factory.
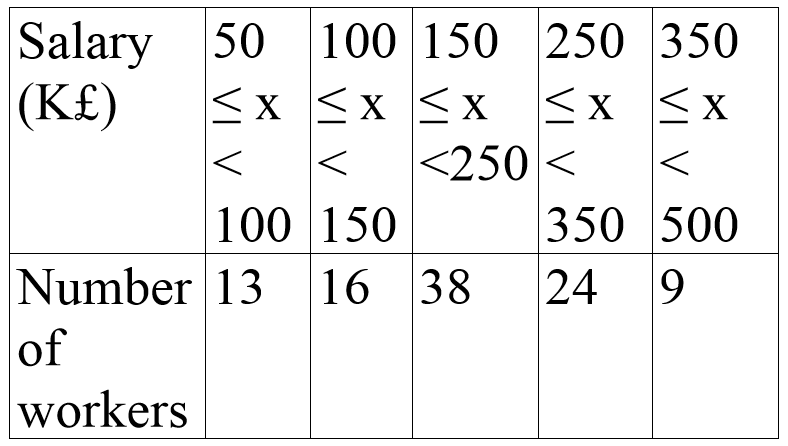
On the grid provided below, draw a histogram to represent the information shown above.