 Get premium membership
 and access revision papers with marking schemes, video lessons and live classes.
The table below shows the ages in tears of 60 people who attended a conference.
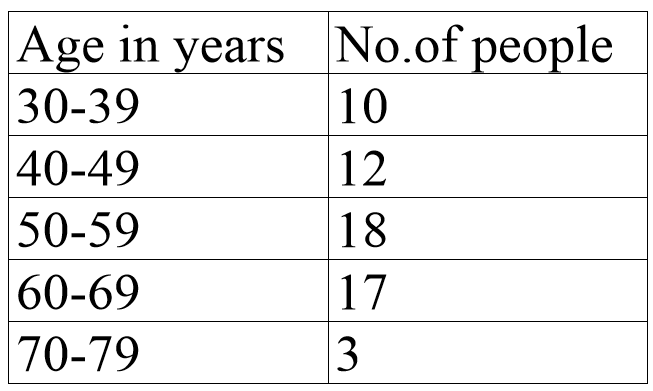
Calculate:
(a)the interquartile range of the data (b)the percentage of the people in the conference whose ages were 54.5 years and below